Code
shinylive::export("old_shiny", "new_shinylive")


httpuv::runStaticServer("new_shinylive/")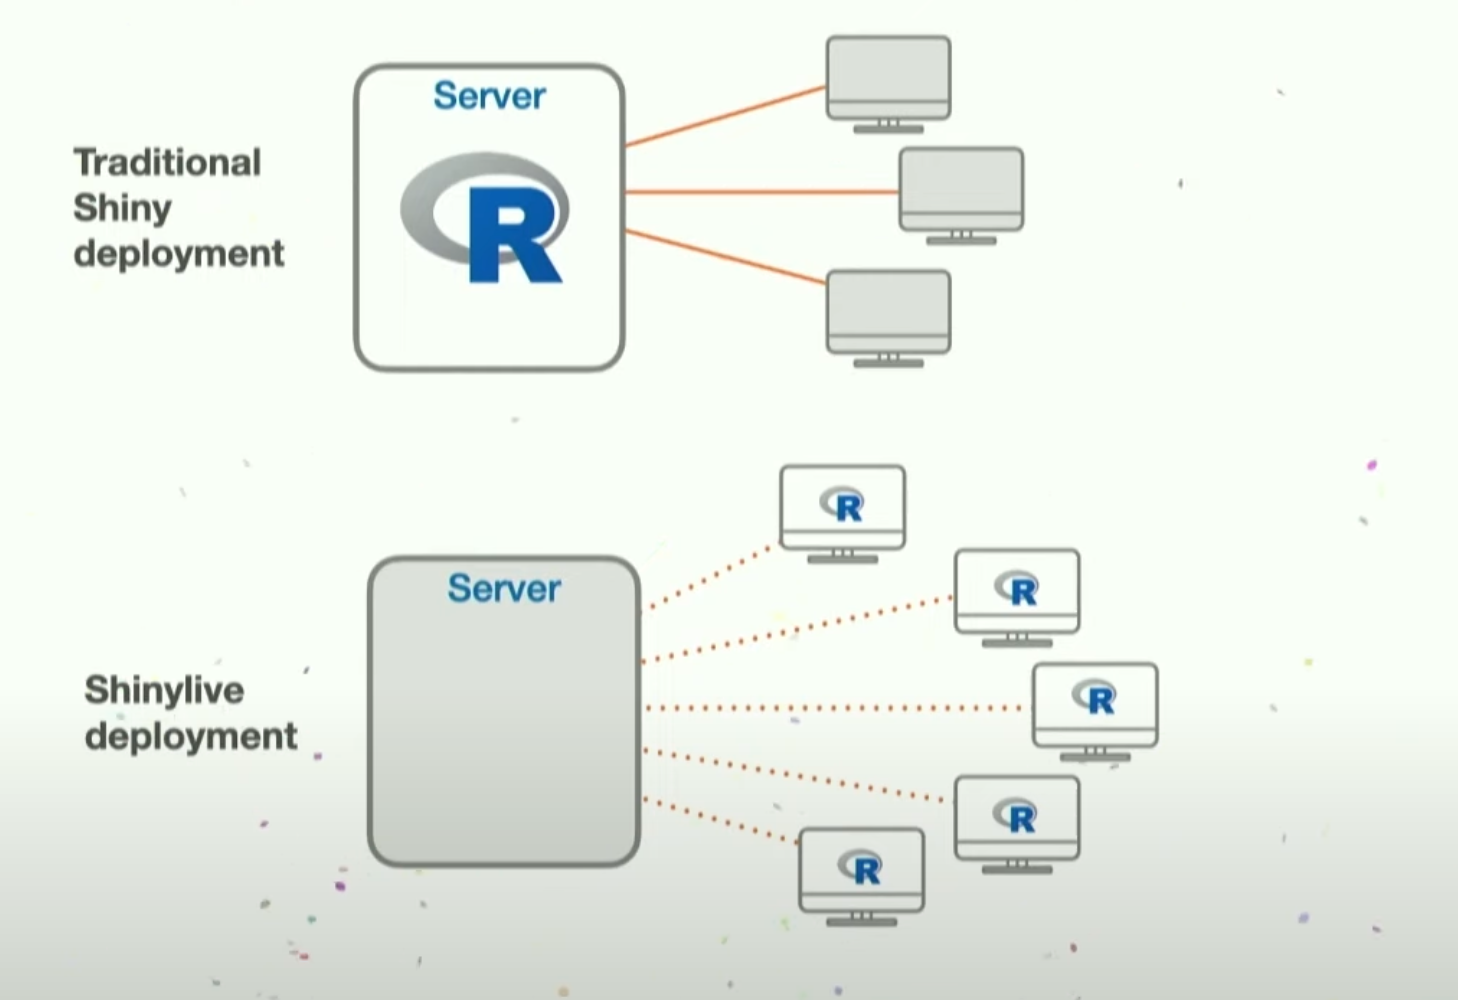
There are 3 ways to convert shiny into shinylive:
shinylive::export("old_shiny", "new_shinylive")
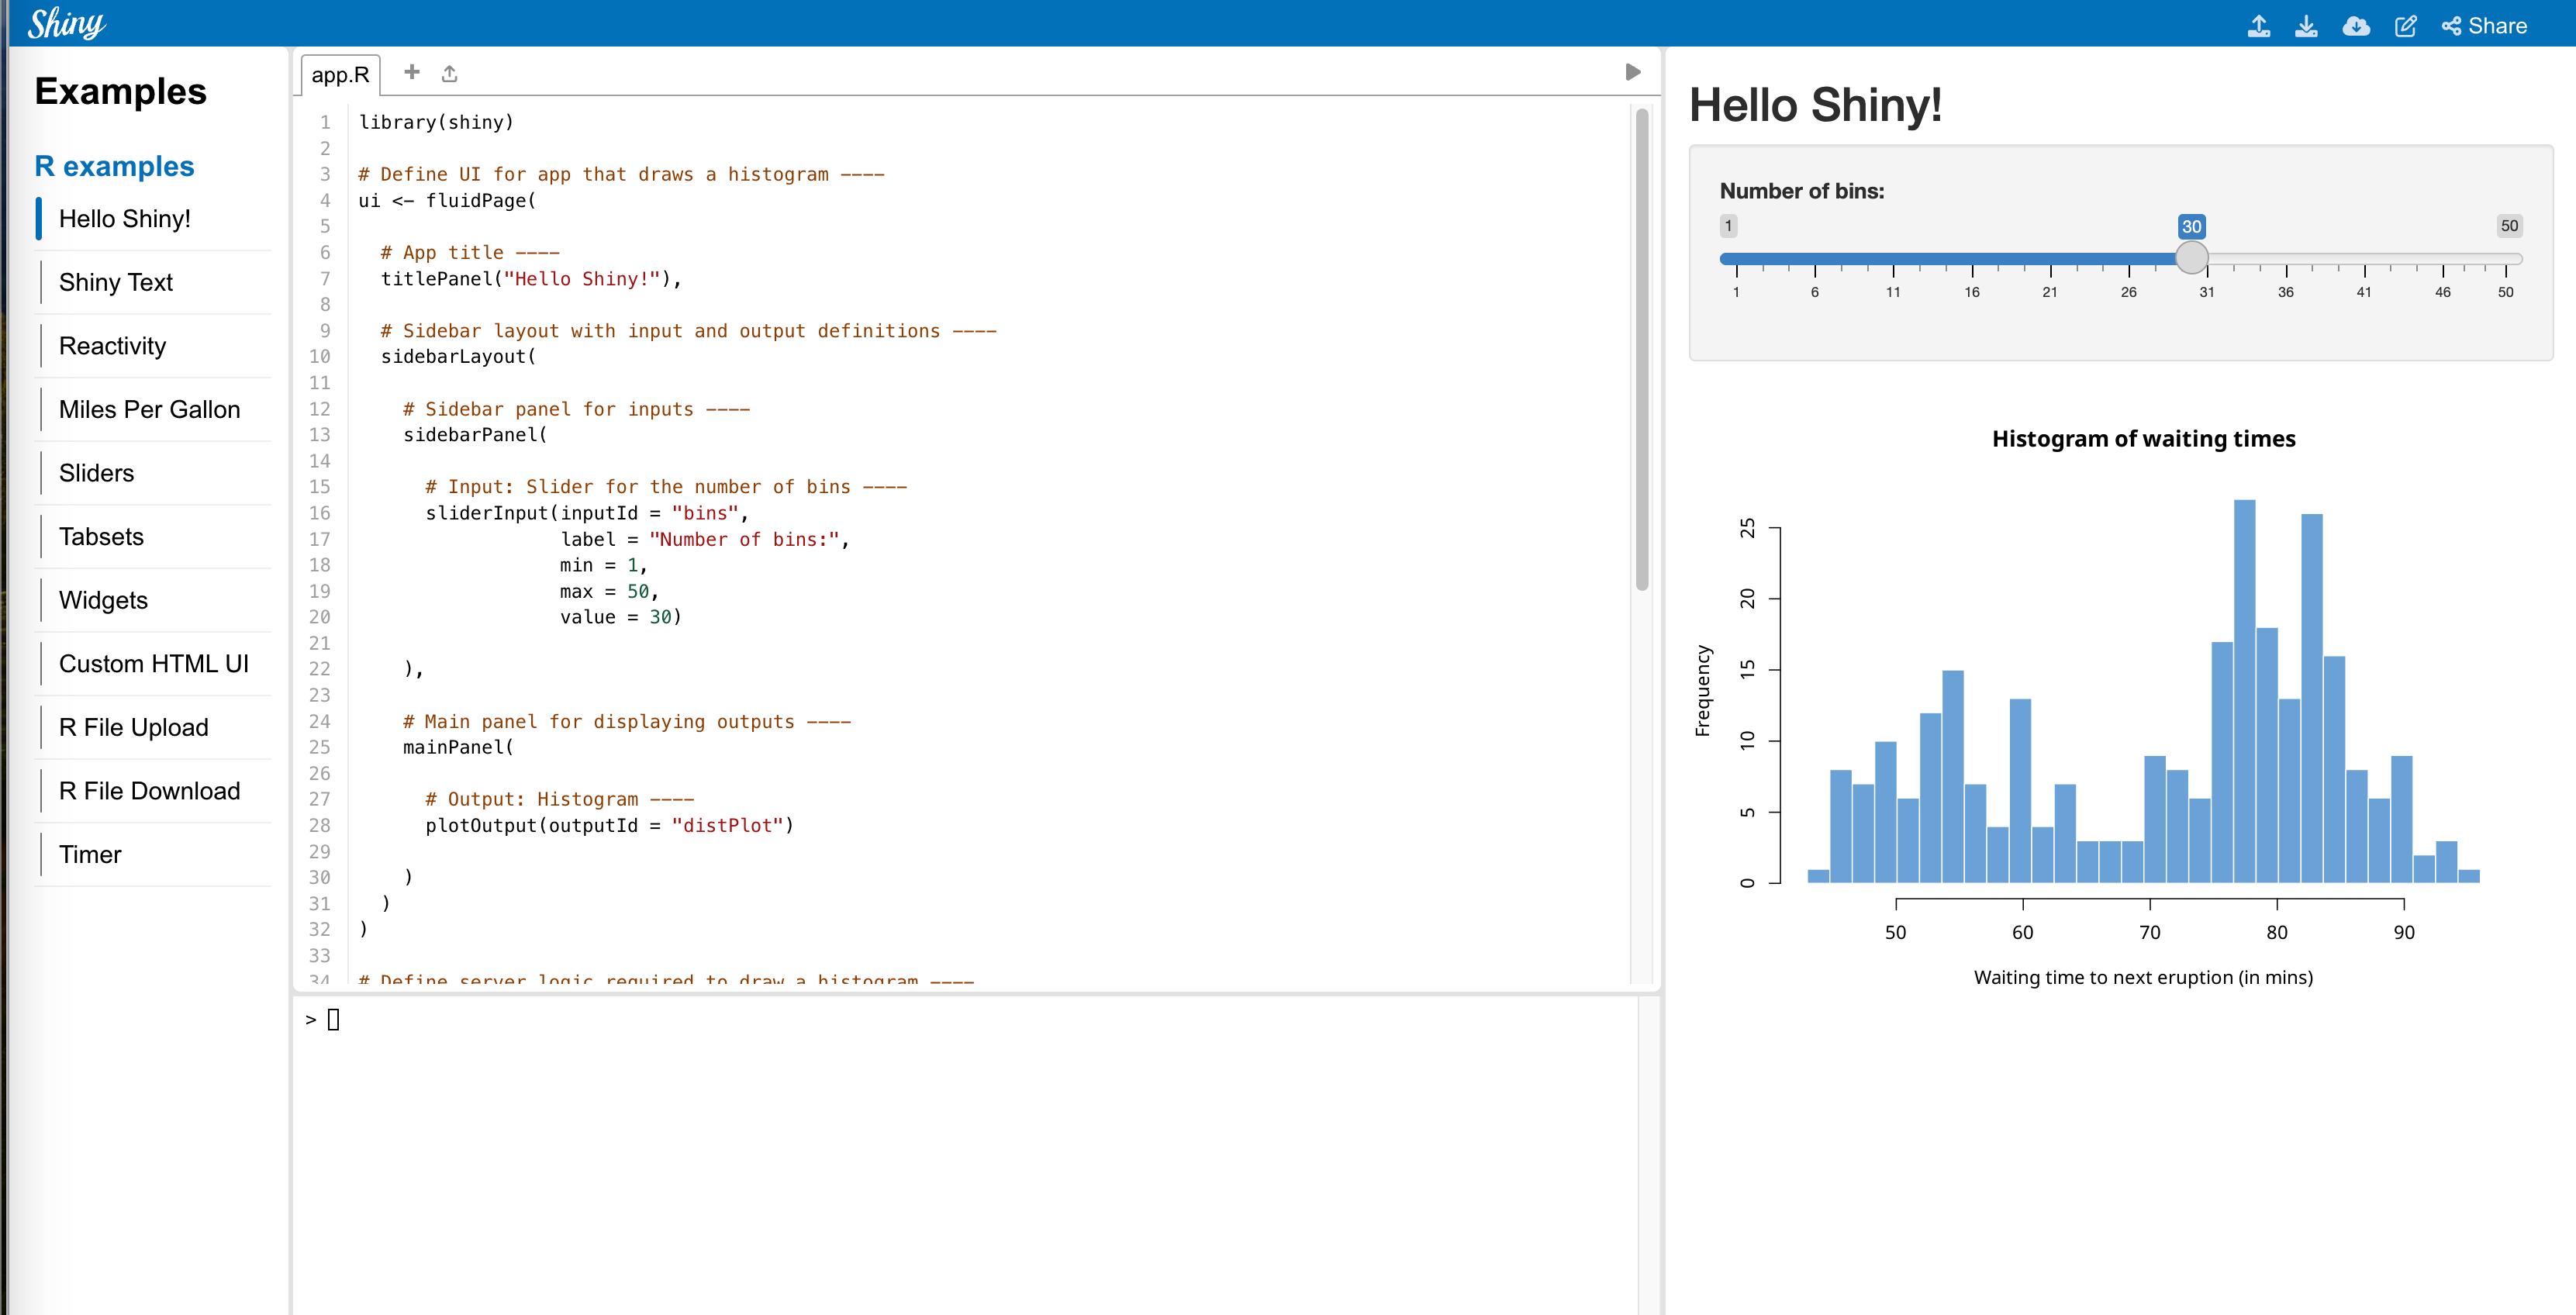
httpuv::runStaticServer("new_shinylive/")create shinylive on live at https://shinylive.io/r/examples/
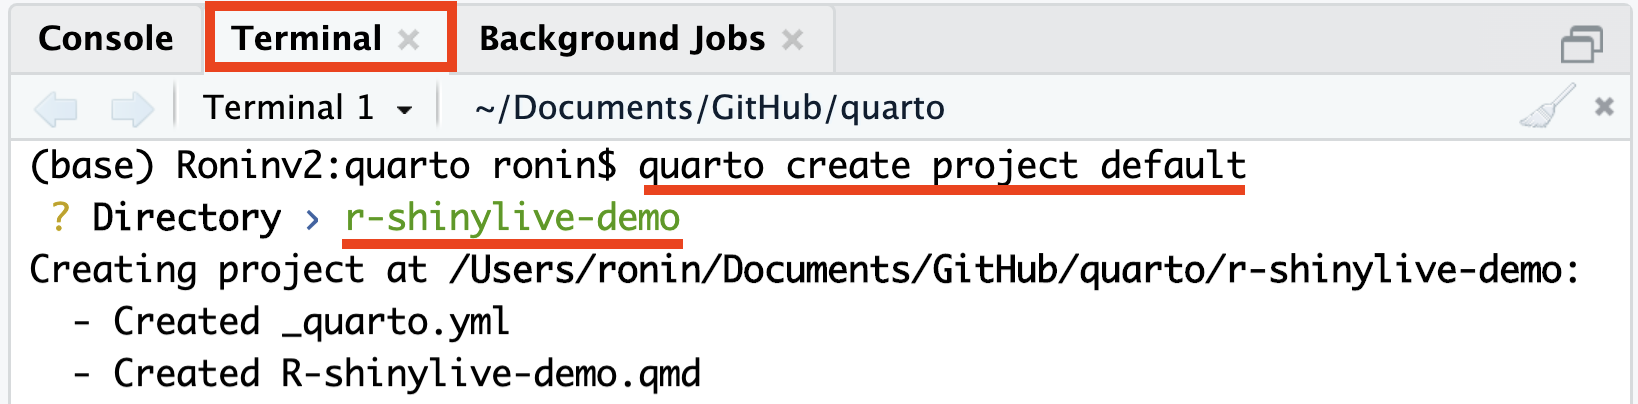
create shinylive inside quarto
# Install the 'pak' package manager if you haven't already
install.packages("pak")
# Install 'r-shinylive' using 'pak'
pak::pak("posit-dev/r-shinylive")quarto create project defaultit will create file “_quarto.yml” (delete this file when creating quarto blog)
quarto add quarto-ext/shinylivefilters:
- shinylive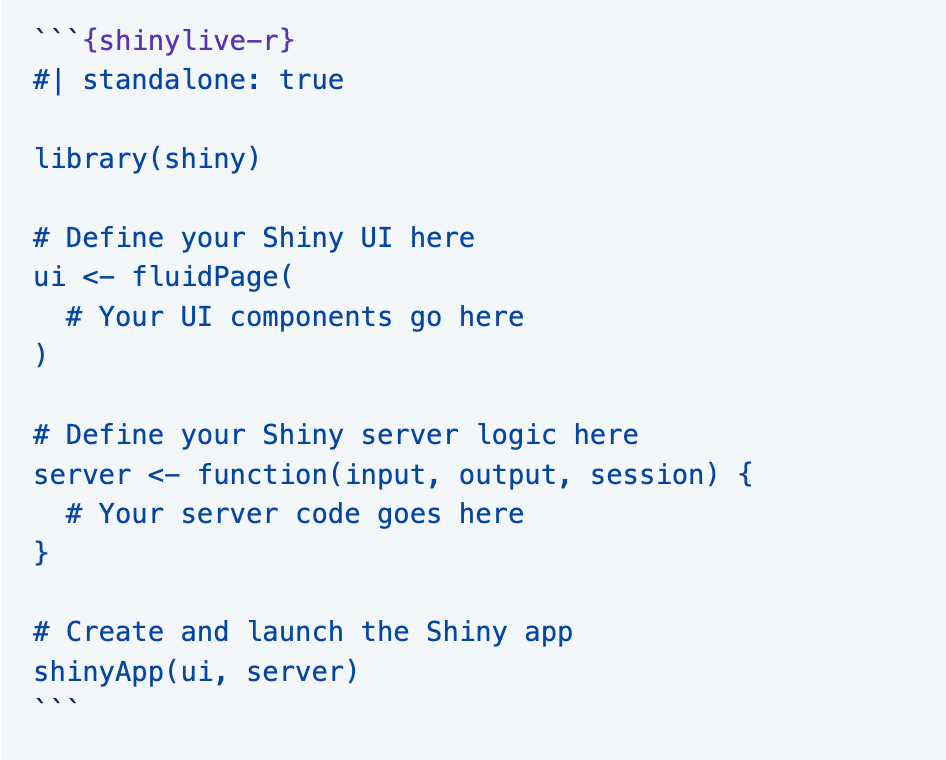
Example:
#| standalone: true
#| viewerHeight: 600
library(shiny)

# Define UI for app that draws a histogram ----
ui <- fluidPage(

  # App title ----
  titlePanel("Hello Shiny!"),

  # Sidebar layout with input and output definitions ----
  sidebarLayout(

    # Sidebar panel for inputs ----
    sidebarPanel(

      # Input: Slider for the number of bins ----
      sliderInput(inputId = "bins",
                  label = "Number of bins:",
                  min = 1,
                  max = 50,
                  value = 30)

    ),

    # Main panel for displaying outputs ----
    mainPanel(

      # Output: Histogram ----
      plotOutput(outputId = "distPlot")

    )
  )
)

# Define server logic required to draw a histogram ----
server <- function(input, output) {

  # Histogram of the Old Faithful Geyser Data ----
  # with requested number of bins
  # This expression that generates a histogram is wrapped in a call
  # to renderPlot to indicate that:
  #
  # 1. It is "reactive" and therefore should be automatically
  #    re-executed when inputs (input$bins) change
  # 2. Its output type is a plot
  output$distPlot <- renderPlot({

    x    <- faithful$waiting
    bins <- seq(min(x), max(x), length.out = input$bins + 1)

    hist(x, breaks = bins, col = "#007bc2", border = "white",
         xlab = "Waiting time to next eruption (in mins)",
         main = "Histogram of waiting times")

    })

}

# Create Shiny app ----
shinyApp(ui = ui, server = server)
```{shinylive-r}
  #| standalone: true
  #| viewerHeight: 600

library(shiny)

# Define UI for app that draws a histogram ----
ui <- fluidPage(

  # App title ----
  titlePanel("Hello Shiny!"),

  # Sidebar layout with input and output definitions ----
  sidebarLayout(

    # Sidebar panel for inputs ----
    sidebarPanel(

      # Input: Slider for the number of bins ----
      sliderInput(inputId = "bins",
                  label = "Number of bins:",
                  min = 1,
                  max = 50,
                  value = 30)

    ),

    # Main panel for displaying outputs ----
    mainPanel(

      # Output: Histogram ----
      plotOutput(outputId = "distPlot")

    )
  )
)

# Define server logic required to draw a histogram ----
server <- function(input, output) {

  # Histogram of the Old Faithful Geyser Data ----
  # with requested number of bins
  # This expression that generates a histogram is wrapped in a call
  # to renderPlot to indicate that:
  #
  # 1. It is "reactive" and therefore should be automatically
  #    re-executed when inputs (input$bins) change
  # 2. Its output type is a plot
  output$distPlot <- renderPlot({

    x    <- faithful$waiting
    bins <- seq(min(x), max(x), length.out = input$bins + 1)

    hist(x, breaks = bins, col = "#007bc2", border = "white",
         xlab = "Waiting time to next eruption (in mins)",
         main = "Histogram of waiting times")

    })

}

# Create Shiny app ----
shinyApp(ui = ui, server = server)
```
https://www.youtube.com/watch?v=j1M6YyU2ZX8
https://www.youtube.com/watch?v=6y2FnAugP8E
https://github.com/coatless-quarto/r-shinylive-demo